Interactive legends for .Net LiveCharts
How to add an interactive legend to a LiveCharts chart which enables to toggle the visibility of series.
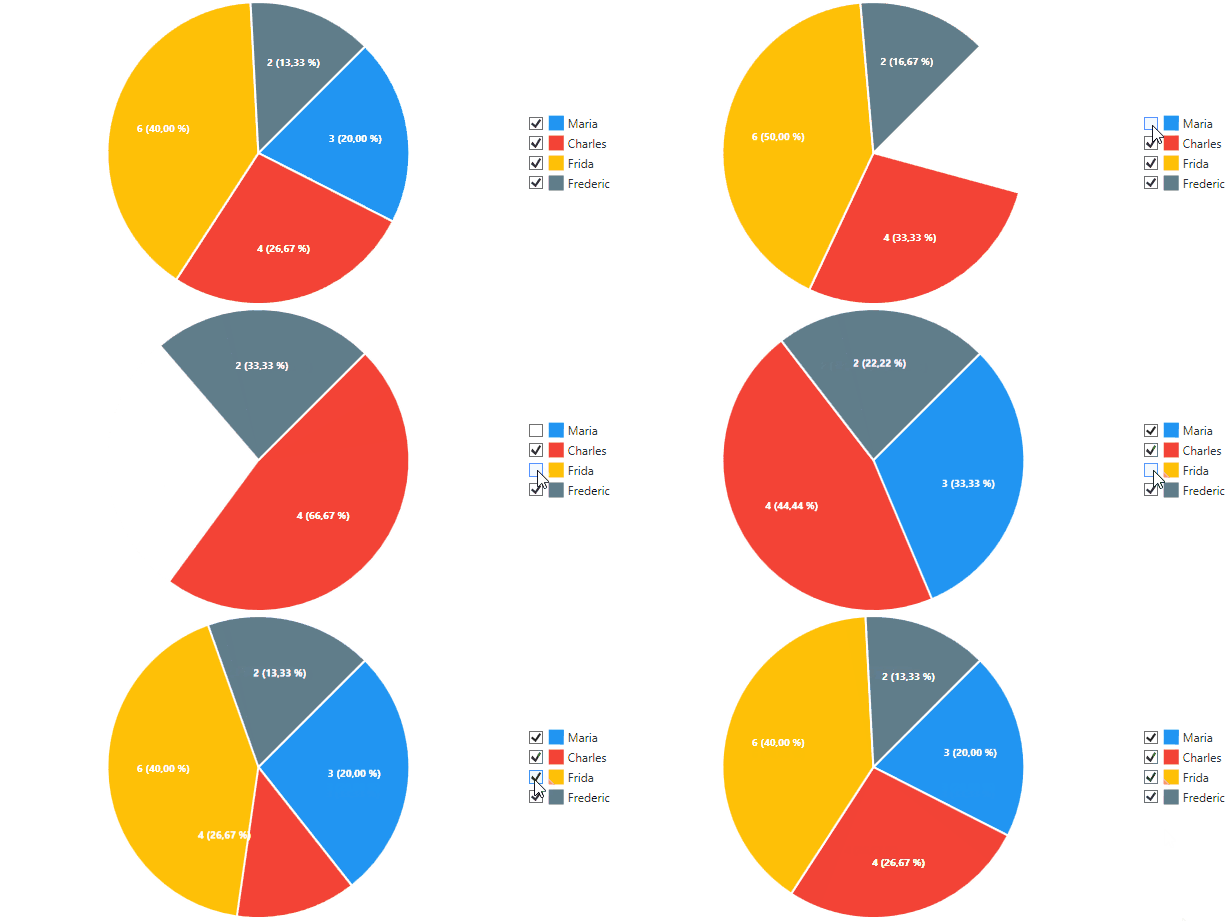
LiveCharts is a great charting library for WPF/UWP. In this blog post I want to show you how you can create a custom legend for a dynamic chart with checkboxes which toggle the visibility of the individual series, such as in the following animation:

As starting ground we use the PieChart example which can be found in LiveCharts’s extensive online documentation. The example uses a legend of type DefaultLegend which we now want to replace with a custom implementation.
The procedure to implement a custom chart legend in described in the Customizing Tooltips section of the documentation. Basically, you have to create a UserControl which implements the interface IChartLegend and set it as the chart’s legend control:
public interface IChartLegend : INotifyPropertyChanged
{
    // Gets or sets the series.
    List<SeriesViewModel> Series { get; set; }
}
The chart then injects the entries by setting (i.e. exchanging the whole list) the Series property. We can now easily create a custom legend which has a checkbox in front of every entry and uses squares instead of circles for the series color by creating a user control like this: XAML:
<ItemsControl x:Name="itemsControl" ItemsSource="{Binding LegendEntries}" Grid.IsSharedSizeScope="True">
    <ItemsControl.ItemsPanel>
        <ItemsPanelTemplate>
            <StackPanel Orientation="{Binding Orientation}"/>
        </ItemsPanelTemplate>
    </ItemsControl.ItemsPanel>
    <ItemsControl.ItemTemplate>
        <DataTemplate>
            <Grid Margin="2">
                <Grid.ColumnDefinitions>
                    <ColumnDefinition Width="Auto"/>
                    <ColumnDefinition Width="Auto"/>
                    <ColumnDefinition Width="Auto" SharedSizeGroup="Title"/>
                </Grid.ColumnDefinitions>
                <CheckBox IsChecked="{Binding IsVisible}" VerticalAlignment="Center" />
                <Rectangle Grid.Column="1" Fill="{Binding Fill}" Width="15" Height="15" Margin="5 0 0 0" VerticalAlignment="Center"/>
                <TextBlock Grid.Column="2" Margin="4 0" Text="{Binding Title}" VerticalAlignment="Center" />
            </Grid>
        </DataTemplate>
    </ItemsControl.ItemTemplate>
</ItemsControl>
Code-behind:
public partial class CustomLvChartLegend : UserControl, IChartLegend
{
    /// <summary>
    /// Orientation of the legend entries
    /// </summary>
    public Orientation Orientation
    {
        get { return (Orientation)GetValue(OrientationProperty); }
        set { SetValue(OrientationProperty, value); }
    }

    public static readonly DependencyProperty OrientationProperty =
        DependencyProperty.Register("Orientation", typeof(Orientation), typeof(CustomLvChartLegend), new PropertyMetadata(Orientation.Horizontal));

    public CustomLvChartLegend()
    {
        InitializeComponent();

        itemsControl.DataContext = this;
    }

    public ObservableCollection<SeriesViewModel> LegendEntries { get; } = new ObservableCollection<SeriesViewModel>();

    public List<SeriesViewModel> Series {
        get => LegendEntries.Select(x => x.SeriesViewModel).ToList();
        set
        {
        	// the Series property is not observable
        	// so we add the entries to our own ObserableCollection
			LegendEntries.Clear();
			foreach (var svm in value)
            	LegendEntries.Add(svm);

            OnPropertyChanged();
        }
    }

    public event PropertyChangedEventHandler PropertyChanged;

    protected virtual void OnPropertyChanged([CallerMemberName]string propertyName = "")
    {
        if (PropertyChanged != null)
            PropertyChanged.Invoke(this, new PropertyChangedEventArgs(propertyName));
    }
}
An instance of this control can now be set as legend of the pie chart from the example:
<lvc:PieChart x:Name="chart" LegendLocation="Right" DataClick="Chart_OnDataClick" Hoverable="False" DataTooltip="{x:Null}">
    <lvc:PieChart.ChartLegend>
        <c:CustomLvChartLegend Orientation="Vertical" />
    </lvc:PieChart.ChartLegend>

    <lvc:PieChart.Series>
        <lvc:PieSeries Title="Maria" Values="3" DataLabels="True"
                       LabelPoint="{Binding PointLabel}" />
        <lvc:PieSeries Title="Charles" Values="4" DataLabels="True"
                       LabelPoint="{Binding PointLabel}"/>
        <lvc:PieSeries Title="Frida" Values="6" DataLabels="True"
                       LabelPoint="{Binding PointLabel}"/>
        <lvc:PieSeries Title="Frederic" Values="2" DataLabels="True"
                       LabelPoint="{Binding PointLabel}"/>
    </lvc:PieChart.Series>
</lvc:PieChart>
This displays the legend but clicking the checkboxes has no effect yet. To implement hiding of series we have to solve two problems:
- The legend only gets SeriesViewModel objects, currently (as of LiveCharts v0.9.6) there is no readily-implemented way to get the corresponding series view element
- When hiding a series, LvCharts removes its SeriesViewModel from the series list it passes to the legend (this means that hiding a series also removes the entry from the legend with no possibility for the user to reshow the series)
To get the UIElement which represents the series in the actual chart we need to retrieve the chart which contains the legend and have to find the corresponding ISeriesView from the charts Series collection.
We can search WPF’s visual tree for the legend’s parent chart by using VisualTreeHelper.GetParent(child); until we end up at the Chart control. To get the UIElement we just take the series which has the same title as the SeriesViewModel (but that means we do not support multiple series with the same title). To store this information we create a class called CustomSeriesViewModel which wraps the original SeriesViewModel. This viewmodel has a property IsVisible which toggles the visibility of the series UIElement:
public class CustomSeriesViewModel : ViewModelBase
    {
        public string Title { get => SeriesViewModel.Title; }

        public Brush Fill { get => SeriesViewModel.Fill ?? SeriesViewModel.Stroke; }

        public SeriesViewModel SeriesViewModel { get; }

        public ISeriesView View { get; }

        public bool IsVisible
        {
            get => ((UIElement)View).Visibility == Visibility.Visible;
            set
            {
                if (IsVisible != value)
                {
                    ((UIElement)View).Visibility = value ? Visibility.Visible : Visibility.Hidden;
                }
            }
        }

        public CustomSeriesViewModel(SeriesViewModel svm, ISeriesView view)
        {
            this.SeriesViewModel = svm;
            this.View = view;

        }
    }
We finish the implementation by changing our LegendEntries to contain ‘CustomSeriesViewModel’ instances instead of SeriesViewModel ones and adjusting the legend’s Series setter as follows:
public ObservableCollection<CustomSeriesViewModel> LegendEntries { get; } = new ObservableCollection<CustomSeriesViewModel>();

public List<SeriesViewModel> Series {
    get => LegendEntries.Select(x => x.SeriesViewModel).ToList();
    set
    {
        Chart ownerChart = GetOwnerChart();

        // note: value only contains the visible series
        // remove all entries which also have been removed from the chart
        var removedSeries = LegendEntries.Where(x => !ownerChart.Series.Any(s => s == x.View)).ToList();
        foreach (var rs in removedSeries)
            LegendEntries.Remove(rs);

        foreach (var svm in value)
        {
            // add entries which are new
            // The SeriesViewModel instances are always new, so we have to compare using the title
            if (!LegendEntries.Any(x => x.Title == svm.Title))
            {
                // find the series' UIElement by title
                var seriesView = ownerChart.Series.FirstOrDefault(x => x.Title == svm.Title);
                LegendEntries.Add(new CustomSeriesViewModel(svm, seriesView));
            }
        }
        OnPropertyChanged();
    }
}
In order to not remove the legend entries of hidden series (which is the default behavior as mentioned above), we keep track of legend entries which still exists in the chart’s Series collection and keep them. If a series has been removed from the chart completely, we also remove its legend entry. Thankfully, all of the animated adding/removing of the series in the chart is completely handled by LiveCharts already.
The complete source code of the extended sample project is available at github.
